Hibbs writeup - OpenToAll practice CTF
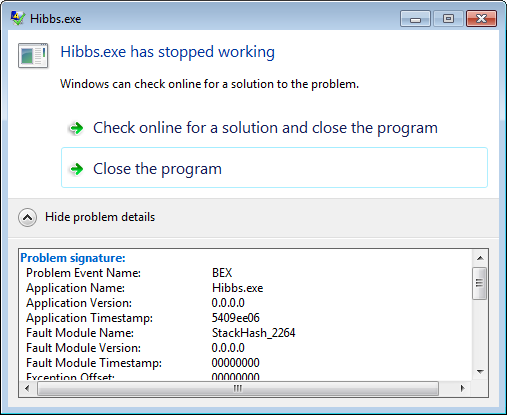
Recently, Eriner set up a practice CTF event for the OpenToAll CTF team, and he asked Alessandro to create a reverse engineering challenge for it. “Hibbs” is the challenge Alessandro created. It consists of an executable named Hibbs.exe. I have no idea what it will actually do, so I fire up a 64-bit Windows VM and run it. However, the program just crashes:
Then, I decide to run it in WinDbg to see if I can figure out anything else about what’s going on.
CommandLine: C:\Users\gaffe\Downloads\practicectf\Hibbs\Hibbs.exe
Symbol search path is: *** Invalid ***
****************************************************************************
* Symbol loading may be unreliable without a symbol search path.           *
* Use .symfix to have the debugger choose a symbol path.                   *
* After setting your symbol path, use .reload to refresh symbol locations. *
****************************************************************************
Executable search path is:
ModLoad: 00000000`00400000 00000000`00405000   image00000000`00400000
ModLoad: 00000000`778f0000 00000000`77a99000   ntdll.dll
ModLoad: 00000000`77ad0000 00000000`77c50000   ntdll32.dll
ModLoad: 00000000`750f0000 00000000`7512f000   C:\Windows\SYSTEM32\wow64.dll
ModLoad: 00000000`75090000 00000000`750ec000   C:\Windows\SYSTEM32\wow64win.dll
ModLoad: 00000000`75080000 00000000`75088000   C:\Windows\SYSTEM32\wow64cpu.dll
(878.b48): Break instruction exception - code 80000003 (first chance)
*** ERROR: Symbol file could not be found.  Defaulted to export symbols for ntdll.dll -
ntdll!CsrSetPriorityClass+0x40:
00000000`7799cb70 cc              int     3
0:000> .symfix
0:000> .reload
Reloading current modules
......
0:000> g
ModLoad: 00000000`777d0000 00000000`778ef000   WOW64_IMAGE_SECTION
ModLoad: 00000000`75ba0000 00000000`75cb0000   WOW64_IMAGE_SECTION
ModLoad: 00000000`777d0000 00000000`778ef000   NOT_AN_IMAGE
ModLoad: 00000000`776d0000 00000000`777ca000   NOT_AN_IMAGE
ModLoad: 00000000`75ba0000 00000000`75cb0000   C:\Windows\syswow64\kernel32.dll
ModLoad: 00000000`75cb0000 00000000`75cf7000   C:\Windows\syswow64\KERNELBASE.dll
ModLoad: 00000000`75e40000 00000000`75e97000   C:\Windows\syswow64\SHLWAPI.dll
ModLoad: 00000000`77270000 00000000`77300000   C:\Windows\syswow64\GDI32.dll
ModLoad: 00000000`77130000 00000000`77230000   C:\Windows\syswow64\USER32.dll
ModLoad: 00000000`75760000 00000000`75800000   C:\Windows\syswow64\ADVAPI32.dll
ModLoad: 00000000`75af0000 00000000`75b9c000   C:\Windows\syswow64\msvcrt.dll
ModLoad: 00000000`756e0000 00000000`756f9000   C:\Windows\SysWOW64\sechost.dll
ModLoad: 00000000`759e0000 00000000`75ad0000   C:\Windows\syswow64\RPCRT4.dll
ModLoad: 00000000`754d0000 00000000`75530000   C:\Windows\syswow64\SspiCli.dll
ModLoad: 00000000`754c0000 00000000`754cc000   C:\Windows\syswow64\CRYPTBASE.dll
ModLoad: 00000000`75ad0000 00000000`75ada000   C:\Windows\syswow64\LPK.dll
ModLoad: 00000000`75640000 00000000`756dd000   C:\Windows\syswow64\USP10.dll
(878.b48): WOW64 breakpoint - code 4000001f (first chance)
First chance exceptions are reported before any exception handling.
This exception may be expected and handled.
ntdll32!LdrpDoDebuggerBreak+0x2c:
77b7103b cc              int     3
0:000:x86> g
ModLoad: 75970000 759d0000   C:\Windows\SysWOW64\IMM32.DLL
ModLoad: 75d70000 75e3c000   C:\Windows\syswow64\MSCTF.dll
(878.b48): WOW64 breakpoint - code 4000001f (first chance)
First chance exceptions are reported before any exception handling.
This exception may be expected and handled.
*** WARNING: Unable to verify checksum for image00000000`00400000
*** ERROR: Module load completed but symbols could not be loaded for image00000000`00400000
image00000000_00400000+0x1742:
00401742 cc              int     3
0:000:x86> g
(878.b48): Access violation - code c0000005 (first chance)
First chance exceptions are reported before any exception handling.
This exception may be expected and handled.
image00000000_00400000+0x1743:
00401743 8802            mov     byte ptr [edx],al          ds:002b:00402fff=00
Okay, so it’s hitting an access violation due to a null dereference. Let’s see what’s going on with the call stack.
0:000:x86> kn
 # ChildEBP RetAddr
WARNING: Stack unwind information not available. Following frames may be wrong.
00 0018fc40 00401361 image00000000_00400000+0x1743
01 0018ff88 75bb338a image00000000_00400000+0x1361
02 0018ff94 77b09f72 kernel32!BaseThreadInitThunk+0xe
03 0018ffd4 77b09f45 ntdll32!__RtlUserThreadStart+0x70
04 0018ffec 00000000 ntdll32!_RtlUserThreadStart+0x1b
Well, the stack seems to be intact, but I have no clue what that sequence of function calls means, because I have no idea what those functions in the Hibbs binary actually do. In order to get more insight about what’s going on, I’m going to open up Hibbs.exe in IDA. I recommend you do the same and follow along. I’m just using the freeware version of IDA for this, so you should be fine if you use it as well.
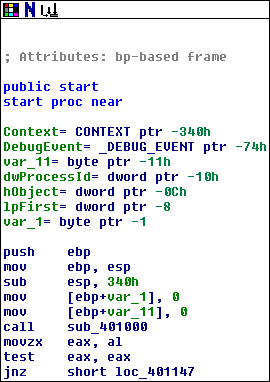
The program starts by zeroing out two variables on the stack, and then it calls some mysterious function sub_401000. After that, it branches based on the value returned by sub_401000: it zero-extends (MOVZX) the lowest byte of EAX (i.e. AL) and uses that to determine whether to continue or not, so we can conclude that this is probably a boolean value. Let’s take a look at sub_401000 and see if we can figure out what it does. Apparently it’s doing something important enough that the program will exit if it fails.
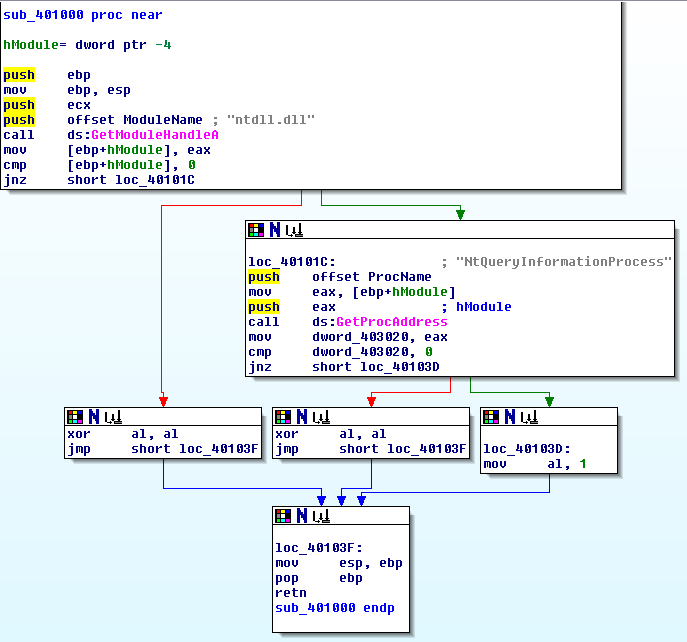
When you’re reversing a Windows program, you’re going to run into a lot of different Windows APIs. It’s quite helpful to have an idea of what these APIs do so that you can figure out what the program is trying to accomplish. If you run into an API that you don’t know, by all means go and look it up. (For reference, by the time I solved this challenge, I had about 20 tabs open in my browser, each with a different MSDN page about a Windows API.) Just skimming through this function here, you’ll see that there are references to GetModuleHandleA and GetProcAddress.
Without even necessarily looking at what these function calls are doing, we can see that there are 3 blocks that take place right before the function exits that set the value of AL (the lowest byte of EAX). Two of them zero out AL using “XOR AL, AL”, whereas the third one sets AL to 1 before returning. From what we saw earlier about how the program is behaving based on the return value of this function, we know that the “XOR AL, AL” blocks represent a failure case, which will cause the program to exit. In other words, for this program to work, it needs to reach the “MOV AL, 1” block. Let’s take a look at what needs to happen in order for us to reach it.
First off, we have the GetModuleHandle block. The “A” at the end of GetModuleHandleA indicates that it’s the ASCII-specific version of GetModuleHandle (whereas the Unicode version would be called GetModuleHandleW). Upon looking up GetModuleHandle, we find that its purpose is to “retrieve a module handle for the specified module”. That explanation might not make sense if you don’t know what a module is, so I’ll go into more detail about that presently.
A “module” is any binary (i.e. a file containing executable code) that has been loaded by a process. If you write a program that uses some specific DLL, then when the program runs, that DLL will be loaded by the program as a “module”. If you run a program in WinDbg and run “lm” (List Modules), you can see what modules a program has loaded. From IDA’s disassembly, we can see that the module being passed to this function is “ntdll.dll”, so that’s the module we’re getting a handle for. Once GetModuleHandleA returns, the program moves the return value into a stack variable that IDA has conveniently automatically named “hModule”. Then, the program checks to see whether hModule is NULL, which would indicate that we failed to get a valid handle for some reason. If the handle returned is non-NULL, then we advance to the next block.
In the next block, the program calls GetProcAddress, which also requires some explanation. GetProcAddress is another Windows API whose purpose is to obtain the address of a function in a DLL that is currently loaded, so that the function can call it. Windows provides multiple ways of accessing a function that is contained inside a separate module, and GetProcAddress is one of them. The usual way to use it is to first call the LoadLibrary API, which loads a DLL, and then call GetProcAddress in order to retrieve the address of a specific function exported by that DLL. However, in this case, the call to LoadLibrary is not needed, because we’re trying to get the address of a function contained within ntdll.dll, which is loaded by every Windows process automatically.
With all that being said, we can see from IDA that we’re trying to get the address of yet another Windows API, NtQueryInformationProcess, which will presumably be used later on. sub_401000 stores the return value of NtQueryInformationProcess in dword_43020 and then checks whether it is NULL. If it’s non-NULL, the program returns 1 to indicate success, leaving the return value stored in dword_43020. At this point, now that we have figured out what’s stored in the variable dword_43020 as well as what the function sub_401000 is doing, I strongly recommend that you rename them in IDA to more human-readable names to make things easier to understand later on. I renamed dword_403020 to “addr_NtQueryInformationProcess” and I renamed sub_401000 to “GetProcAddress_NtQueryInformationProcess”. We’re pretty much done here, so let’s go back to the main function and take a look at the next block in the sequence. Assuming that GetModuleHandle and GetProcAddress succeed, we’ll end up here:
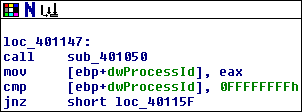
This is actually quite similar to the previous block: it’s calling some function sub_401050 and then checking its return value. If the return value is anything other than 0xffffffff, then the program will move on to the next block. Just like before, let’s have a look at sub_401050 and see if we can figure out what it’s doing:
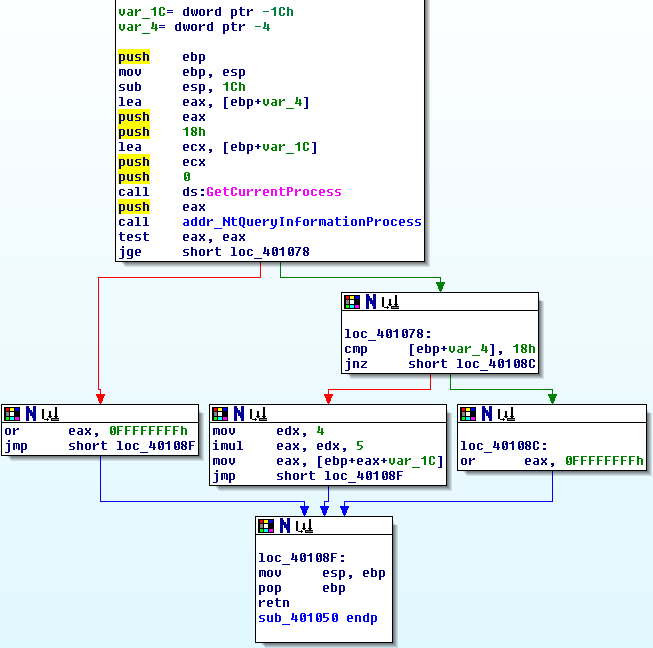
Similar to “GetProcAddress_NtQueryInformationProcess”, this function has 3 blocks right before it returns. Two of them set eax to 0xffffffff, which we know represents a failure case, and one of them does some weird stuff with pointer arithmetic, which apparently represents success somehow. More on that later.
This function calls some Windows APIs, just like the previous one. The first one is GetCurrentProcess, which takes no arguments and essentially returns a handle to the current process. This is no big deal: a handle to the current process is required for many operations. Right after that, we can see that this function pushes the return value of GetCurrentProcess onto the stack and then calls the address of NtQueryInformationProcess that we obtained earlier using GetProcAddress. This would be a good time to read about NtQueryInformationProcess.
NtQueryInformationProcess takes 5 arguments. You’ll notice that there are several PUSH instructions (highlighted) before GetCurrentProcess, even though GetCurrentProcess doesn’t take any arguments. This means that some of the arguments to NtQueryInformationProcess were actually pushed onto the stack even before GetCurrentProcess was called. This is a little confusing, but it’s most likely due to compiler optimization. For the standard calling conventions, the arguments are pushed into the stack in reverse order (or “right to left” while reading the function declaration). The first value that gets pushed onto the stack as an argument to NtQueryInformationProcess is EAX at the beginning of the function, so we can conclude that this is actually the fifth and final argument to NtQueryInformationProcess, “ReturnLength”. Before being PUSHed onto the stack, the program uses the LEA instruction to EAX to the address of a stack variable. IDA has assigned this stack variable a default name of “var_4”.
Working backwards from there, we can check which other values are being pushed onto the stack in order to find all 5 arguments being passed to NtQueryInformationProcess:
- ProcessHandle: EAX (return value of GetCurrentProcess)
- ProcessInformationClass: 0 (this value corresponds to ProcessBasicInformation; see MSDN page)
- ProcessInformation: var_1C
- ProcessInformationLength: 0x18
- ReturnLength: var_4
Since we know what some of these variables are for (at least in this context), let’s go ahead and rename them. Change “var_1C” to “ProcessInformation” and change “var_4” to “ReturnLength”. Judging from this, we can see that we’re passing NtQueryInformationProcess a handle to the current process (i.e. Hibbs.exe) with the ProcessBasicInformation flag. This will set ProcessInformation (formerly var_1C) to a pointer to a struct looking like this:
typedef struct _PROCESS_BASIC_INFORMATION {
    PVOID Reserved1;
    PPEB PebBaseAddress;
    PVOID Reserved2[2];
    ULONG_PTR UniqueProcessId;
    PVOID Reserved3;
} PROCESS_BASIC_INFORMATION;
There are 6 pointers contained within this struct (notice that Reserved2 is actually an array of 2 PVOIDs). Since this is a 32-bit program, all of the pointers will be 32 bits long, or 4 bytes. The struct will consequently take up 6 * 4 = 24 = 0x18 bytes in memory. That means that the ProcessInformationLength value of 0x18 specified by the program should be correct based on the size of the struct being requested.
Once NtQueryInformationProcess returns, the program checks its return value, which we know from MSDN is an NTSTATUS value. All NTSTATUS values that indicate errors start with the most significant bit set (e.g. 0x8000000, 0xc0000000, etc.), which means that when interpreted as signed values, they will be negative. The “jge” instruction checks whether the return value of NtQueryInformationProcess is greater than equal to zero in order to verify that no errors took place. If that is the case, it continues onward.
Once it gets to the next block, loc_401078, it checks to see that ReturnLength is 0x18. If it's not, that indicates that the program didn't get the amount of data that it expected from NtQueryInformationProcess, which it considers a failure case. If it did receive 0x18 bytes, however, then the program decides that it has received the information it wants. In this case, it does not jump to loc_40108c and instead lands at this block:
mov     edx, 4
imul    eax, edx, 5
mov     eax, [ebp+eax+ProcessInformation]
jmp     short loc_40108F
As I said earlier, there’s some complicated-looking pointer arithmetic here, so let’s go through it instruction by instruction to try to understand what’s happening:
- “MOV EDX, 4” sets the value of EDX to 4.
- “IMUL EAX, EDX, 5” multiplies EDX by 5 and then sets EAX to that value. This is equivalent to simply setting EAX to 20, or 0x14.
- “MOV EAX,[EBP+EAX+ProcessInformation]” is a little tricky to read. The brackets indicate that the value contained within them is to be dereferenced as a memory address, and the value stored there will be placed into EAX. From IDA, EBP+ProcessInformation simply refers to the ProcessInformation stack variable discussed earlier. EAX contains 0x14 as a result of the IMUL directly above. As a result, this effectively means that EAX is being set to the data located 0x14 bytes after the start of the ProcessInformation structure. This value corresponds to the “UniqueProcessId” field of the PROCESS_BASIC_INFORMATION structure. This means that the purpose of this sequence of instructions was effectively to find the process ID of the current process, and return it.
- “JMP SHORT loc_40108F” unconditionally jumps to the block at the end of the function that cleans up the stack and returns.
Now that we’ve analyzed sub_401050, rename it to something human-readable like “FindProcessID”, and head back to the main function again. Once you get back there, you’ll see that the program moves the value returned by FindProcessID into a stack variable. In my case, IDA had already automatically named this stack variable “dwProcessId”, which helps in a sense to confirm that this variable is holding onto a process ID.
Assuming that the program is able to find the process ID successfully, execution will move on to the next block:
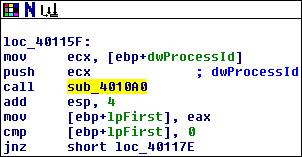
In this block, the program moves dwProcessId into ECX, pushes it onto the stack, and then calls a function. Then it adds 4 to ESP to reclaim stack space, implying that the function it called was using the Cdecl calling convention. After that, it moves this function’s return value into EAX and fails out of the program if the value is zero. Let’s look at the function that this block is calling, which is currently known as sub_4010a0:
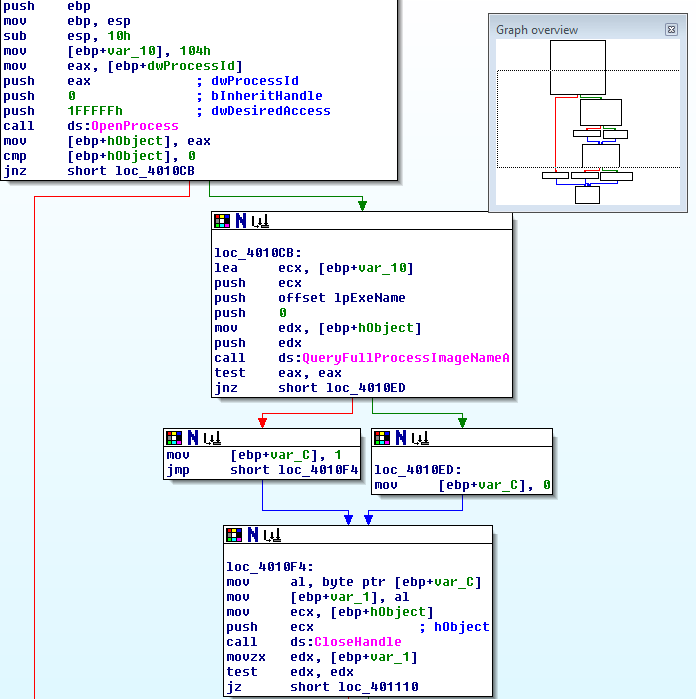
Unfortunately, I couldn’t fit this one in a single screen, but you can see from IDA’s “Graph overview” window that I was able to get everything except 3 small blocks before the end of the function. Like before, this function ends with 2 failure cases and 1 success case.
This function starts by making 4 DWORDs worth of space (0x10) on the stack, and then it loads the value 0x104 (decimal 260) into one of those DWORDs. Then it pushes a few arguments onto the stack and calls OpenProcess. IDA was again nice enough to automatically tell us which values correspond to which function arguments:
- dwDesiredAccess: 0x1fffff (Essentially, set every flag so that this handle will get any and all access rights it can.)
- bInheritHandle: 0 (This value prevents new processes created by the current process from inheriting the handle returned by this OpenProcess call.)
- dwProcessId: dwProcessId (This is the process ID value returned by the FindProcessID function we analyzed earlier.)
The return value of OpenProcess is copied from EAX to the stack variable hObject. If hObject is non-NULL, the program considers it a valid handle to the process. Then the program goes on to call the ASCII version of QueryFullProcessImageName with these arguments:
- hProcess: hObject (This is the handle returned by OpenProcess.)
- dwFlags: 0 (Specifies that “The name should use the Win32 path format.”)
- lpExeName: unk_403028 (QueryFullProcessImageName will write the name of the executable to unk_403028, so go ahead and rename this value to “lpExeName”.)
- lpdwSize: var_10 (Again, rename stack variable var_10 to lpdwSize.)
If QueryFullProcessImageName returns 0, the program sets var_C to 1; if QueryFullProcessImageName returns a nonzero value, the program sets var_C to 0. In either case, the program will end up back at loc_4010f4.
loc_4010f4 copies the value of var_C to var_1. Then, it calls CloseHandle on hObject. Apparently, the program has all the information it needed from this handle, and it doesn’t need it anymore. With that done, it checks whether var_1 is zero, and if it is, it jumps to the “success” case at loc_401110, where eax is loaded with the address of lpExeName. (Note: I’m honestly not sure why var_C is copied to var_1; inside this function, they only ever seem to hold the same value, so having two variables for that seems like a waste of stack space.)
At a high level, the purpose of this function is to get a handle to a process, use the handle to get the filename of the running process, and then close out the handle. I think it would be reasonable to rename this function to something like “GetNameOfProcess”.
Once we go back to the main function, the program moves the return value of GetNameOfProcess into the stack variable lpFirst and fails out of the program if that value is NULL.
After this, the program launches into a series of 7 code blocks that are all identical except for a value that’s pushed onto the stack before a function call:
push    offset [changing values]
call    sub_401380
add     esp, 4
push    eax             ; lpSrch
mov     ecx, [ebp+lpFirst]
push    ecx             ; lpFirst
call    ds:StrStrIA
test    eax, eax
jz      short [failure]
Each block calls the function sub_401380 with a different input value as the argument to the function. Then, it uses the return value of this mysterious function as an argument to StrStrI. The second argument to StrStrI is lpFirst, which is the return value of GetNameOfProcess. In other words, the program is doing a comparison between the value returned by sub_401380 and the name of the running program. If the comparison comes up equal, then the program jumps to some sort of failure case, and if not, it continues on to the next block.
At this point I’m too lazy to fully analyze sub_401380, so I’m going to just use a debugger to see what it returns. I’m going to use WinDbg for this, because it’s the debugger I’m most comfortable with. I recommend that you follow along in your debugger of choice.
0:000> bp 401380
*** WARNING: Unable to verify checksum for image00000000`00400000
*** ERROR: Module load completed but symbols could not be loaded for image00000000`00400000
0:000> g
ModLoad: 00000000`77660000 00000000`7777f000   WOW64_IMAGE_SECTION
ModLoad: 00000000`75c30000 00000000`75d40000   WOW64_IMAGE_SECTION
ModLoad: 00000000`77660000 00000000`7777f000   NOT_AN_IMAGE
ModLoad: 00000000`77560000 00000000`7765a000   NOT_AN_IMAGE
ModLoad: 00000000`75c30000 00000000`75d40000   C:\Windows\syswow64\kernel32.dll
ModLoad: 00000000`75ad0000 00000000`75b17000   C:\Windows\syswow64\KERNELBASE.dll
ModLoad: 00000000`76790000 00000000`767e7000   C:\Windows\syswow64\SHLWAPI.dll
ModLoad: 00000000`753c0000 00000000`75450000   C:\Windows\syswow64\GDI32.dll
ModLoad: 00000000`763d0000 00000000`764d0000   C:\Windows\syswow64\USER32.dll
ModLoad: 00000000`757b0000 00000000`75850000   C:\Windows\syswow64\ADVAPI32.dll
ModLoad: 00000000`75ee0000 00000000`75f8c000   C:\Windows\syswow64\msvcrt.dll
ModLoad: 00000000`77480000 00000000`77499000   C:\Windows\SysWOW64\sechost.dll
ModLoad: 00000000`760c0000 00000000`761b0000   C:\Windows\syswow64\RPCRT4.dll
ModLoad: 00000000`75360000 00000000`753c0000   C:\Windows\syswow64\SspiCli.dll
ModLoad: 00000000`75350000 00000000`7535c000   C:\Windows\syswow64\CRYPTBASE.dll
ModLoad: 00000000`75950000 00000000`7595a000   C:\Windows\syswow64\LPK.dll
ModLoad: 00000000`774c0000 00000000`7755d000   C:\Windows\syswow64\USP10.dll
(b98.8e8): WOW64 breakpoint - code 4000001f (first chance)
First chance exceptions are reported before any exception handling.
This exception may be expected and handled.
ntdll32!LdrpDoDebuggerBreak+0x2c:
77a0103b cc              int     3
0:000:x86> g
ModLoad: 75850000 758b0000   C:\Windows\SysWOW64\IMM32.DLL
ModLoad: 76560000 7662c000   C:\Windows\syswow64\MSCTF.dll
Breakpoint 0 hit
image00000000_00400000+0x1380:
00401380 55              push    ebp
0:000:x86> gu
image00000000_00400000+0x1188:
00401188 83c404          add     esp,4
0:000:x86> da eax
00403130  "win32_remote.exe"
The program is checking to see if the current process is called “win32_remote.exe”. A quick search tells us that this is the name of IDA’s remote debugger. As we continue to step through the program, we see several other filenames that it checks for:
0:000:x86> g
Breakpoint 0 hit
image00000000_00400000+0x1380:
00401380 55              push    ebp
0:000:x86> gu
image00000000_00400000+0x11ad:
004011ad 83c404          add     esp,4
0:000:x86> da eax
00403130  "ollydbg.exe"
[...]
0:000:x86> da eax
00403130  "idag.exe"
[...]
0:000:x86> da eax
00403130  "idaq.exe"
[...]
0:000:x86> da eax
00403130  "idag64.exe"
[...]
0:000:x86> da eax
00403130  "idaq64.exe"
[...]
0:000:x86> da eax
00403130  "ImmunityDebugger.exe"
Actually, the program is checking to see if the current process’ name is “win32_remote.exe”, “ollydbg.exe”, “idag.exe”, “idaq.exe”, “idag64.exe”, “idaq64.exe”, or “ImmunityDebugger.exe”. If so, it branches to some sort of failure case. This looks to be some kind of anti-debugging technique. Luckily, I was using WinDbg, which was not included in this list of known debuggers, so I didn’t have to worry about it.
After making it past these anti-debugging blocks, the program ends up at loc_401273, which looks like this:
movzx   eax, [ebp+var_1]
test    eax, eax
jz      loc_401353
The program zero-extends var_1 (a variable that has not yet been set if we made it this far) and stores it in EAX in order to check whether it is non-zero. If it is zero, the program branches to loc_401353. In our case, this variable should indeed be 0, so this branch will be taken:
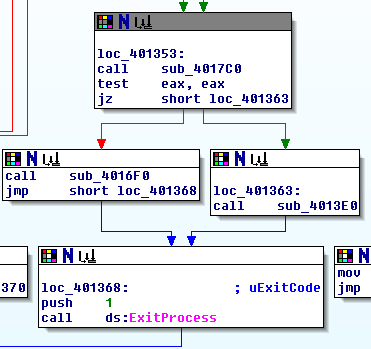
This block starts by calling sub_4017C0. If sub_4017C0 returns zero, the program calls sub_4013E0; otherwise, it calls sub_4016F0. Either way, once that sequence of 2 function calls is done, the program will exit. Let’s analyze sub_4017C0.
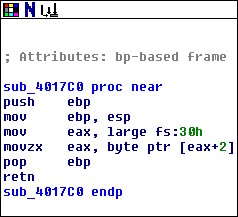
This is a pretty short one. If we ignore the function prologue and epilogue, all this function does is load the data at an offset of 0x30 from the FS register (one of the x86 segment registers) into EAX. Then it interprets that value as a memory address, adds an offset of 0x2 to that address, and reads a single byte from that location. The function then returns that byte’s value via EAX.
Some Windows-specific knowledge is needed to understand what’s actually going on here. In the context of each thread of each 32-bit Windows process, the segment register FS always holds the address of a data structure known as the Thread Information Block (TIB) or Thread Environment Block (TEB). Offset 0x30 of this data structure contains the address of yet another Windows data structure, the Process Environment Block (PEB).
Offset 0x2 of the PEB just so happens to be a variable called BeingDebugged, which tells whether a process is being debugged or not. This is the value that the function is returning. In fact, there is a Windows API called IsDebuggerPresent that does effectively the same thing as this function. However, if the program were to use this API, it would be fairly obvious to a reverser that it was checking for a debugger. Therefore, this API was intentionally rewritten in order to obfuscate its true purpose, which is to provide another anti-debugging check.
Since we know what this function does now, let’s rename it to “IsDebuggerPresent” in IDA and start looking back at loc_401353 again:
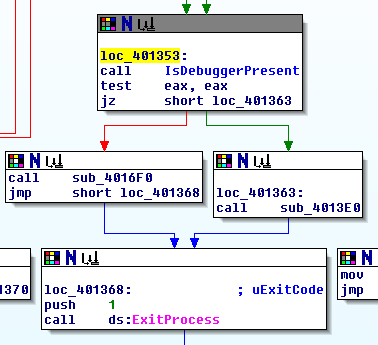
In this updated version, we can see that it’s checking whether a debugger is present. If there is no debugger present, it calls sub_4013E0, so that’s almost certainly the function call we’re interested in.
Let’s go back to WinDbg (or your debugger of choice) and modify the return value of IsDebuggerPresent in order to access this block:
0:000:x86> bp 401353
0:000:x86> g
Breakpoint 1 hit
image00000000_00400000+0x1353:
00401353 e868040000      call    image00000000_00400000+0x17c0 (004017c0)
0:000:x86> p
image00000000_00400000+0x1358:
00401358 85c0            test    eax,eax
0:000:x86> r eax
eax=00000001
0:000:x86> r eax=0
0:000:x86> t
image00000000_00400000+0x135a:
0040135a 7407            je      image00000000_00400000+0x1363 (00401363) [br=1]
0:000:x86> t
image00000000_00400000+0x1363:
00401363 e878000000      call    image00000000_00400000+0x13e0 (004013e0)
0:000:x86> t
image00000000_00400000+0x13e0:
004013e0 55              push    ebp
This lands us at address 004013e0 in the debugger, which is the start of the function that is called if a debugger is not present. Now that we’ve gotten there successfully, let’s flip back to IDA to see what this function does. We know that this is the last function call before the program exits, and we haven’t run into anything that looks like a flag yet, so it’s likely that something important is taking place inside this function.
The first thing you might notice about this function while looking at it from within IDA is that it’s way more complicated than any of the functions we’ve looked at so far:
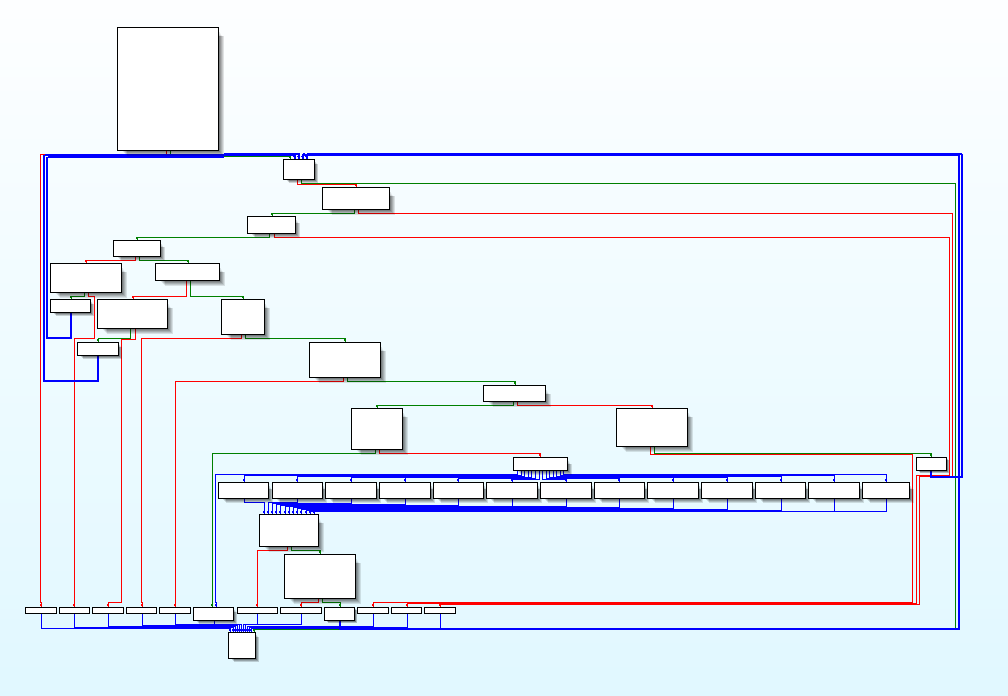
Just glancing at the first block of the function in the upper left, we can see that it has a branch that could immediately skip almost directly to the end of the function. We can conclude that this probably also represents some kind of failure case. Let’s keep that in mind as we look more closely at that first block:
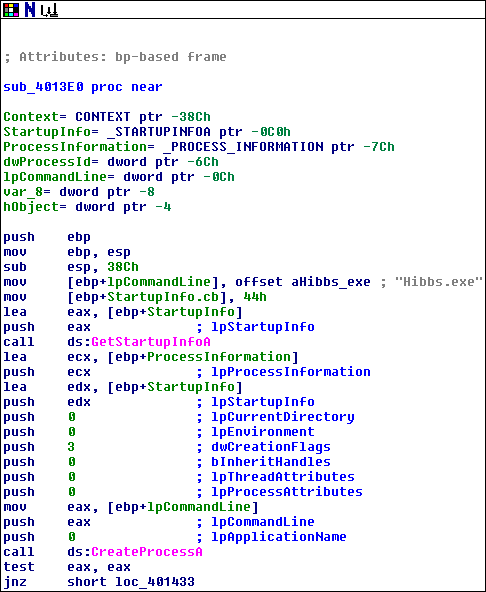
The function starts by creating a bunch of stack space. It loads the address of a literal string “Hibbs.exe” stored within the binary into the stack variable lpCommandLine. Then it somewhat inexplicably loads 0x44 into the stack variable “StartupInfo”. After that, it pushes StartupInfo onto the stack and calls GetStartupInfo, another Windows API.
GetStartupInfo takes one argument — which is actually an output value — called lpStartupInfo. lpStartupInfo is expected to be a memory location where you’d like to store a pointer to a STARTUPINFO structure. The STARTUPINFO structure looks like this:
typedef struct _STARTUPINFO {
  DWORD  cb;
  LPTSTR lpReserved;
  LPTSTR lpDesktop;
  LPTSTR lpTitle;
  DWORD  dwX;
  DWORD  dwY;
  DWORD  dwXSize;
  DWORD  dwYSize;
  DWORD  dwXCountChars;
  DWORD  dwYCountChars;
  DWORD  dwFillAttribute;
  DWORD  dwFlags;
  WORD   wShowWindow;
  WORD   cbReserved2;
  LPBYTE lpReserved2;
  HANDLE hStdInput;
  HANDLE hStdOutput;
  HANDLE hStdError;
} STARTUPINFO, *LPSTARTUPINFO;
A STARTUPINFO structure is one of the arguments you need to provide when creating a new Windows process. GetStartupInfo actually lets you retrieve the STARTUPINFO structure that was passed when a process was originally created. For some reason, Hibbs wants some piece of information from this data structure. Perhaps there could be another anti-debugging technique coming up.
After the call to GetStartupInfo, the program pushes a bunch of things onto the stack and calls CreateProcess. As you might guess from its name, this API creates a new process. IDA automatically detected all of the arguments for us, so let’s look at them in more detail:
-
lpApplicationName: 0 (“The lpApplicationName parameter can be NULL. In that case, the module name must be the first white space–delimited token in the lpCommandLine string.”)
-
lpCommandLine: “Hibbs.exe” (as specified by our stack variable, conveniently named “lpCommandLine”)
-
lpProcessAttributes: 0 (“If lpProcessAttributes is NULL, the handle cannot be inherited.”)
-
lpThreadAttributes: 0 (“If lpThreadAttributes is NULL or lpSecurityDescriptor is NULL, the thread gets a default security descriptor.”)
-
bInheritHandles: 0 (“If this parameter is TRUE, each inheritable handle in the calling process is inherited by the new process. If the parameter is FALSE, the handles are not inherited.”)
-
dwCreationFlags: 3 (DEBUG_PROCESS and DEBUG_ONLY_THIS_PROCESS)
-
lpEnvironment: 0 (“If this parameter is NULL, the new process uses the environment of the calling process.”)
-
lpCurrentDirectory: 0 (“If this parameter is NULL, the new process will have the same current drive and directory as the calling process.”)
-
lpStartupInfo: StartupInfo (the stack variable holding the data returned by GetStartupInfo just now)
-
lpProcessInformation: ProcessInformation (the stack variable holding the PROCESS_BASIC_INFORMATION structure returned by NtQueryInformationProcess a while back)
What all of these options add up to is that the program is actually starting up a new copy of itself with all of the same parameters. However, because of the process creation flags it’s passing, the new copy of Hibbs.exe will be debugged by the current Hibbs.exe. In other words, Hibbs.exe is creating a new copy of itself and then controlling its execution the way a debugger would! This is starting to get pretty interesting. Let’s continue onward and see what happens next.
The last bit of code in this block checks whether CreateProcess returned successfully, and if so, branches to loc_401433:
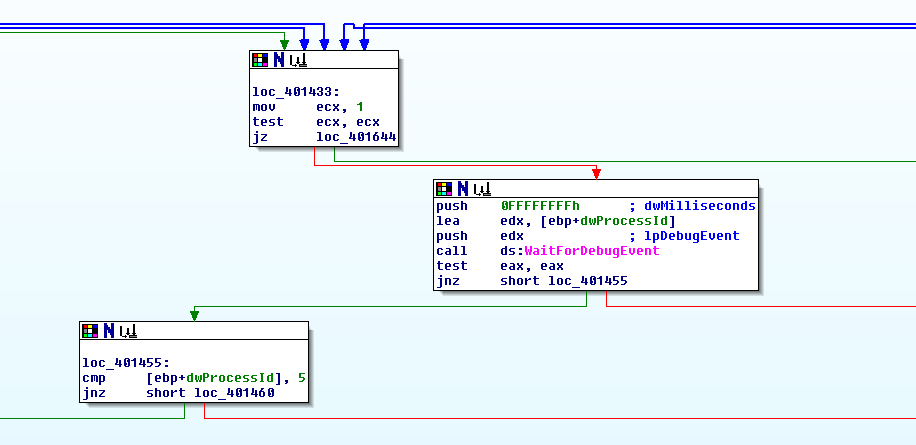
This first block at loc_401433 is a bit weird, depending on how you look at it. This block sets ECX to 1 and then uses the TEST instruction to perform a bitwise AND of ECX with itself and check whether the result is zero or not. It doesn’t really make sense that this check would even be made, because the program just loaded the value 1 into ECX. How could the result of 1 ANDed with 1 ever be equal to zero? There are only two possibilities I can think of right now as to why the program might do this:
-
The first copy of Hibbs program might debug the second copy of Hibbs while it’s executing this instruction and modify the value of ECX in order to cause this branch to be taken.
-
This is how the compiler represents “while(1)”.
Given that the program seems to skip right to the end of this function if that branch is taken, I’m going to say that the latter case is probably more likely.
Assuming that the value of ECX actually stays set to 1, the program will continue to the next block, where the program calls WaitForDebugEvent. This API returns execution control to a debugging target until either the specified timeout elapses or until some debug event occurs in the target process, like a breakpoint or an access violation. Here are the arguments that are being passed:
-
lpDebugEvent: dwProcessId (This is the process ID value returned by the FindProcessID function we analyzed earlier. It’s actually being used for a completely different purpose here, which is to store a pointer to the DEBUG_EVENT structure returned by WaitForDebugEvent.)
-
dwMilliseconds: 0xffffffff (The maximum possible value that can be stored in a DWORD.)
It’s hard to predict what the program will do here, because it’s debugging another copy of Hibbs.exe that we don’t have direct control of. At this point I’m going to switch back to the debugger, set a breakpoint after the WaitForDebugEvent call, and see what happens:
0:000:x86> bp 0040144C
0:000:x86> g
Breakpoint 3 hit
image00000000_00400000+0x144c:
0040144c 85c0            test    eax,eax
0:000:x86> r eax
eax=00000001
Well, WaitForDebugEvent returned 1, so the jump to loc_401455 will be taken. This tiny block checks the value of dwProcessId (which, confusingly, no longer represents a process ID, but a DEBUG_EVENT structure) and compares it to the number 5. Taking a look at the definition of the DEBUG_EVENT structure, the first member of the struct is dwDebugEventCode. A dwDebugEventCode value of 5 corresponds to EXIT_PROCESS_DEBUG_EVENT, which would indicate that the child process has exited. In other words, this branch is checking to see if the second copy of Hibbs.exe exits.
Let’s take a look at what value comes up, and see if it’s 5:
0:000:x86> t
image00000000_00400000+0x144e:
0040144e 7505            jne     image00000000_00400000+0x1455 (00401455) [br=1]
0:000:x86> t
image00000000_00400000+0x1455:
00401455 837d9405        cmp     dword ptr [ebp-6Ch],5 ss:002b:0018fbd4=00000003
We can see from the WinDbg output that it’s actually 3, which corresponds to CREATE_PROCESS_DEBUG_EVENT. All this means is that the target process has just been created, so we’re still very early on in the second Hibbs.exe process’ lifetime. After this, we step on through to another series of blocks that begins at 401460:
0:000:x86> t
image00000000_00400000+0x1459:
00401459 7505            jne     image00000000_00400000+0x1460 (00401460) [br=1]
0:000:x86> t
image00000000_00400000+0x1460:
00401460 837d9401        cmp     dword ptr [ebp-6Ch],1 ss:002b:0018fbd4=00000003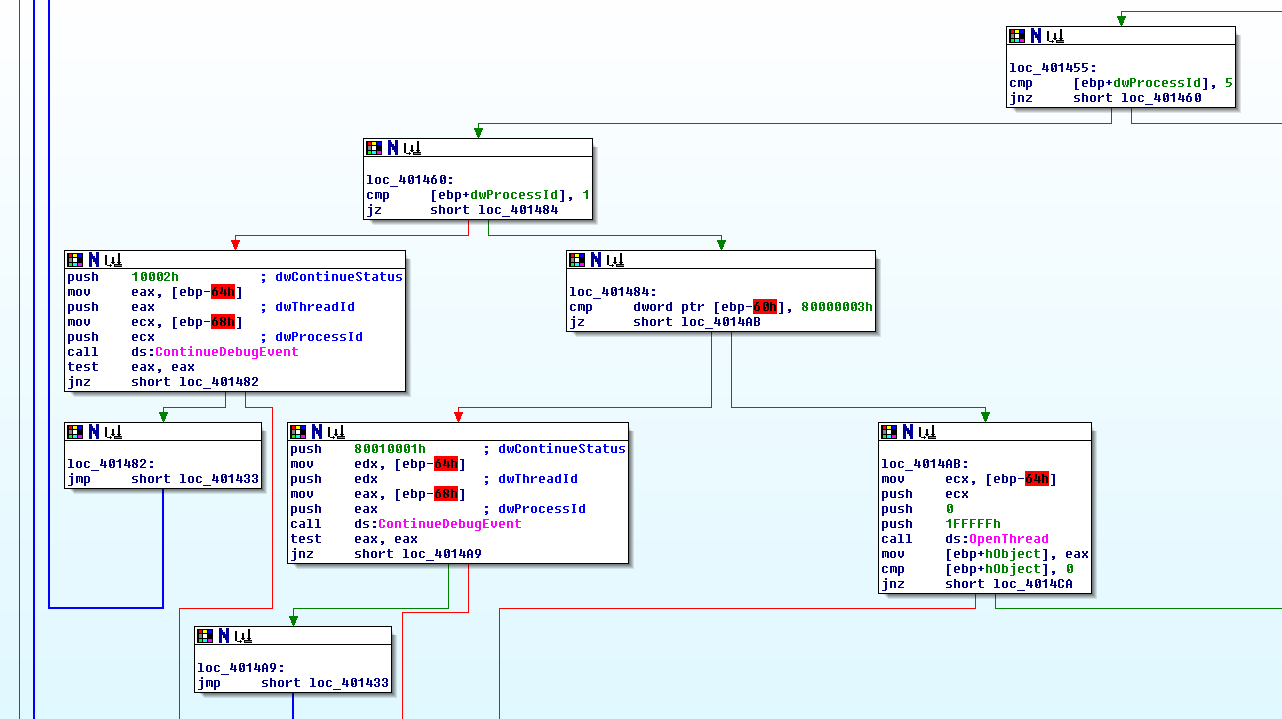
The first thing it does is check for a dwDebugEventCode value of 1, or EXCEPTION_DEBUG_EVENT, which would indicate that the other copy of Hibbs.exe had hit some kind of exception. It seems like the first copy of Hibbs may be expecting the second copy of Hibbs to throw an exception for some reason. In any case, this jump will not be taken right now, because our dwDebugEventCode is 3. As a result, the program will pass through to the block on the left.
This block pushes a few arguments onto the stack and calls ContinueDebugEvent. The purpose of this API is to continue a debugging target’s execution once it’s been broken into. This is basically equivalent to continuing a program in a debugger. After the call to ContinueDebugEvent, the program loops back up almost to the beginning of the function again.
From this, we can conclude that Hibbs1 is setting up a loop in order to let Hibbs2 run until it hits some kind of exception event that it’s interested in. Let’s use our debugger to try to skip forward until this interesting event occurs. The program checks the dwDebugEventCode value at loc_401460, so let’s set a breakpoint and keep running the program until the value is 1:
0:000:x86> bl
 0 e x86 00401380     0001 (0001)  0:**** image00000000_00400000+0x1380
 1 e x86 00401353     0001 (0001)  0:**** image00000000_00400000+0x1353
 2 e x86 00401433     0001 (0001)  0:**** image00000000_00400000+0x1433
 3 e x86 0040144c     0001 (0001)  0:**** image00000000_00400000+0x144c
0:000:x86> bd 2
0:000:x86> bd 3
0:000:x86> bp 401460
0:000:x86> g
Breakpoint 4 hit
image00000000_00400000+0x1460:
00401460 837d9401        cmp     dword ptr [ebp-6Ch],1 ss:002b:0018fbd4=00000006
0:000:x86> g
Breakpoint 4 hit
image00000000_00400000+0x1460:
00401460 837d9401        cmp     dword ptr [ebp-6Ch],1 ss:002b:0018fbd4=00000007
0:000:x86> g
Breakpoint 4 hit
image00000000_00400000+0x1460:
00401460 837d9401        cmp     dword ptr [ebp-6Ch],1 ss:002b:0018fbd4=00000007
0:000:x86> g
Breakpoint 4 hit
image00000000_00400000+0x1460:
00401460 837d9401        cmp     dword ptr [ebp-6Ch],1 ss:002b:0018fbd4=00000007
0:000:x86> g
Breakpoint 4 hit
image00000000_00400000+0x1460:
00401460 837d9401        cmp     dword ptr [ebp-6Ch],1 ss:002b:0018fbd4=00000007
0:000:x86> g
Breakpoint 4 hit
image00000000_00400000+0x1460:
00401460 837d9401        cmp     dword ptr [ebp-6Ch],1 ss:002b:0018fbd4=00000006</code></pre>
So far, we’re just getting a bunch of LOAD_DLL_DEBUG_EVENTs (6) and UNLOAD_DLL_DEBUG_EVENTs (7). These events pretty much always occur at the start of any process, so nothing particularly out of the ordinary is happening yet. After hitting “F5” a few more times, we land at an EXCEPTION_DEBUG_EVENT:
0:000:x86> g
Breakpoint 4 hit
image00000000_00400000+0x1460:
00401460 837d9401        cmp     dword ptr [ebp-6Ch],1 ss:002b:0018fbd4=00000001
Let’s keep stepping and see what happens now:
0:000:x86> t
image00000000_00400000+0x1464:
00401464 741e            je      image00000000_00400000+0x1484 (00401484) [br=1]
0:000:x86> t
image00000000_00400000+0x1484:
00401484 817da003000080  cmp     dword ptr [ebp-60h],80000003h ss:002b:0018fbe0=80000003
The program is checking some value on the stack and comparing it to 0x80000003. 0x80000003 has its first significant bit set, so it looks like some kind of Windows error code. Let’s look it up using WinDbg:
0:000:x86> !error 80000003

Error code: (HRESULT) 0x80000003 (2147483651) - One or more arguments are invalid
If the error code is 0x80000003, then the program branches to a whole new section of the function, and if not, it just continues the debug loop. Apparently, the program was expecting this specific error code to be produced by the second copy of Hibbs.exe, which is a bit surprising.
In any case, Hibbs2 actually did provide the error 0x80000003, so let’s step into this new section of code. It begins at 4014ab:
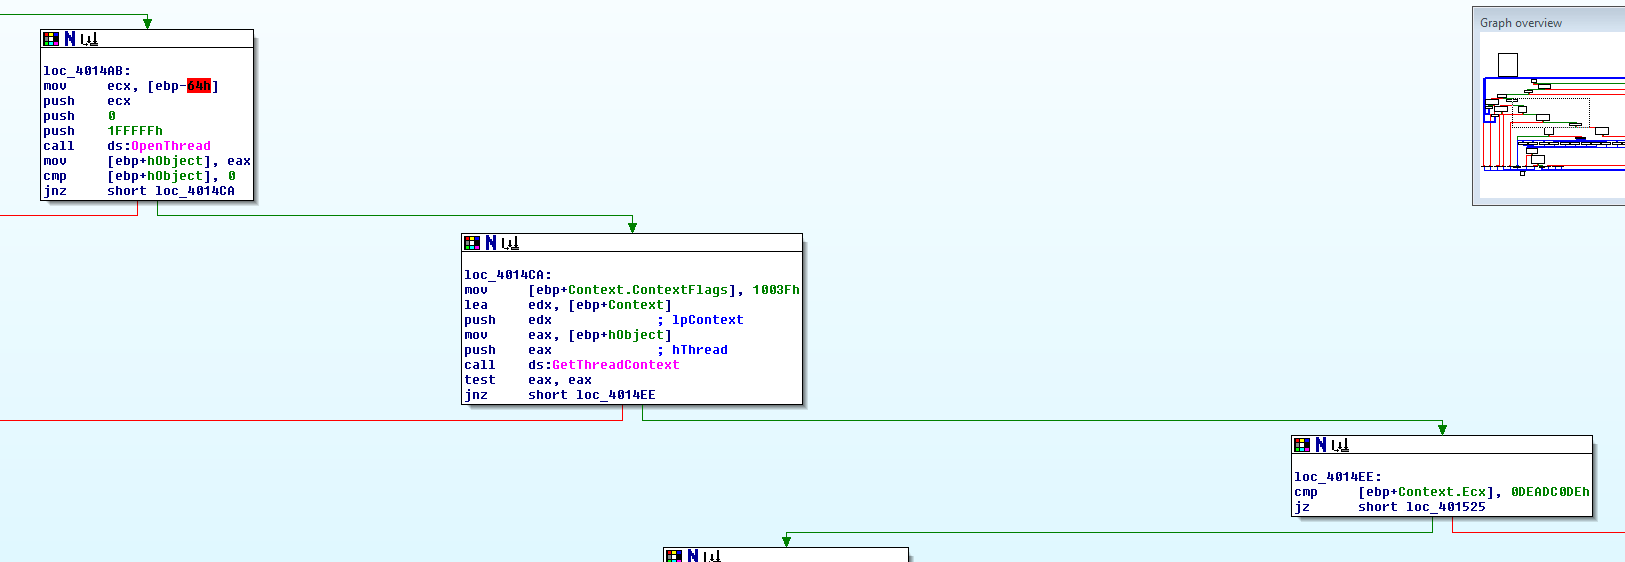
It pushes some arguments and calls OpenThread, which returns a thread handle to a certain thread. Most likely, Hibbs1 is trying to get a handle to a thread in Hibbs2 in order to do something to it or read some information from it. After verifying that OpenThread’s return value is non-NULL, it moves on to the next block at loc_4014CA.</p>
loc_4014CA pushes some more arguments onto the stack and calls GetThreadContext, which returns a pointer to a structure containing the thread’s context. Here, the word “context” refers to a thread’s current register values, so for some reason, Hibbs1 wants to read Hibbs2’s register values. After another null check, the program moves onto loc_4014EE.
loc_4014EE is checks to see if Hibbs2’s ECX value is set to 0xdeadc0de, a “special” human-readable hex value. I decide to step to this point in the debugger to see if this value actually shows up as 0xdeadc0de:
0:000:x86> bp 4014EE
0:000:x86> g
Breakpoint 5 hit
image00000000_00400000+0x14ee:
004014ee 81bd20fdffffdec0adde cmp dword ptr [ebp-2E0h],0DEADC0DEh ss:002b:0018f960=159a0000
It ended up as 0x159a0000 and not 0xdeadc0de. Taking a quick look ahead in IDA, I can see that if this value isn’t equal to 0xdeadc0de, the program will close the handle obtained from OpenThread, call ContinueDebugEvent, and continue the debugging loop. It’s possible that I might need to just tweak Hibbs2’s ECX value to make it 0xdeadc0de in order to get things to work, but let’s just continue execution a few times to see if it ever sets it to 0xdeadc0de on its own:
0:000:x86> g
Breakpoint 3 hit
image00000000_00400000+0x14ee:
004014ee 81bd20fdffffdec0adde cmp dword ptr [ebp-2E0h],0DEADC0DEh ss:002b:0018f960=deadc0de
Its ECX value actually did end up getting set to 0xdeadc0de on the next run through, so we can continue even deeper starting at loc_401525:
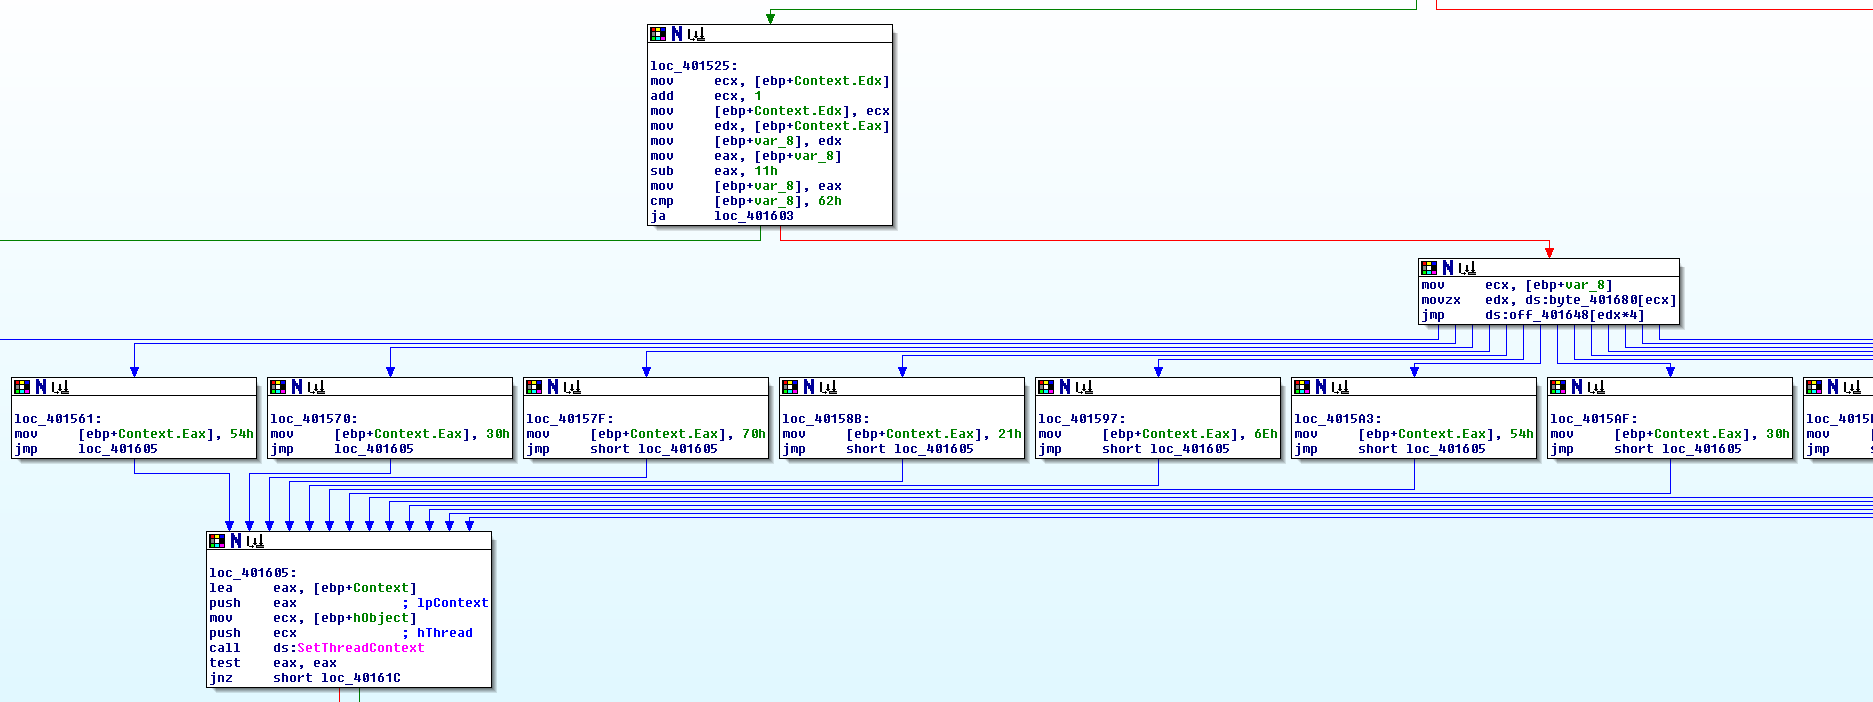
The code starts by doing some weird stuff with the EDX and EAX values of Hibbs2, then it branches to a section where execution splits off between a bunch of very similar blocks. In each of these blocks, Hibbs1 loads a byte value into the EAX register of Hibbs2. Just from looking at these, I can see that each of these byte values getting loaded into EAX are in the ASCII range, so this code may end up dealing with human-readable text in some way.
After the program splits into those 12 separate blocks, it merges back into one block again at loc_401605. Let’s try setting breakpoints before and after the code splits off and see if anything interesting turns up.
0:000:x86> bc *
0:000:x86> bp 0040155A
0:000:x86> bp 00401605
0:000:x86> g
ModLoad: 750a0000 750ec000   C:WindowsSysWOW64apphelp.dll
Breakpoint 1 hit
image00000000_00400000+0x155a:
0040155a ff249548164000  jmp     dword ptr image00000000_00400000+0x1648 (00401648)[edx*4] ds:002b:00401674=00401570
0:000:x86> t
image00000000_00400000+0x1570:
00401570 c78524fdffff30000000 mov dword ptr [ebp-2DCh],30h ss:002b:0018f964=00000071
We can see that out of the 12 blocks it had to choose from, the program ended up jumping to the block loc_401570, which loads the value 0x30 into Hibbs2’s EAX register. 0x30 is the number 0 in ASCII, so it’s possible that this could have some significance. Let’s keep on stepping.
0:000:x86> t
image00000000_00400000+0x157a:
0040157a e986000000      jmp     image00000000_00400000+0x1605 (00401605)
0:000:x86> t
Breakpoint 2 hit
image00000000_00400000+0x1605:
00401605 8d8574fcffff    lea     eax,[ebp-38Ch]
Right here, the program merges back to loc_401605, as noted earlier. Looking at this block, it looks like it calls SetThreadContext to write the new register values back to Hibbs2 and then calls CloseHandle to close the handle obtained earlier from OpenThread. After that, it calls ContinueDebugEvent to continue Hibbs2’s execution and returns back to the beginning of the debugging loop.
At this point, I’d like to see if we’ll come back to the block where the program splits into 12 different blocks and merges again, so I continue execution:
0:000:x86> g
Breakpoint 1 hit
image00000000_00400000+0x155a:
0040155a ff249548164000  jmp     dword ptr image00000000_00400000+0x1648 (00401648)[edx*4] ds:002b:00401650=0040157f
0:000:x86> t
image00000000_00400000+0x157f:
0040157f c78524fdffff70000000 mov dword ptr [ebp-2DCh],70h ss:002b:0018f964=00000013
Interestingly enough, this time, we end up at loc_40157f, where instead of loading 0x30 into Hibbs2’s ECX register, it loads 0x70. As it turns out, 0x70 is a lower-case letter “p” in ASCII. At this point, I’m starting to think that I could be on to something here, so I disable all of the other breakpoints and step through these blocks to see what values come up:
0:000:x86> bl
 0 e x86 00401353     0001 (0001)  0:**** image00000000_00400000+0x1353
 1 e x86 0040155a     0001 (0001)  0:**** image00000000_00400000+0x155a
 2 e x86 00401605     0001 (0001)  0:**** image00000000_00400000+0x1605
0:000:x86> bd 0 2
0:000:x86> g
Breakpoint 1 hit
image00000000_00400000+0x155a:
0040155a ff249548164000  jmp     dword ptr image00000000_00400000+0x1648 (00401648)[edx*4] ds:002b:00401678=004015df
0:000:x86> t
image00000000_00400000+0x15df:
004015df c78524fdffff33000000 mov dword ptr [ebp-2DCh],33h ss:002b:0018f964=00000073
This one is 0x33, or the number 3.
0:000:x86> g
Breakpoint 1 hit
image00000000_00400000+0x155a:
0040155a ff249548164000  jmp     dword ptr image00000000_00400000+0x1648 (00401648)[edx*4] ds:002b:00401670=00401597
0:000:x86> t
image00000000_00400000+0x1597:
00401597 c78524fdffff6e000000 mov dword ptr [ebp-2DCh],6Eh ss:002b:0018f964=00000062
This one is 0x6e, or the letter n. So far we have “0p3n”. Now I’m thinking this pretty much has to be some kind of significant value, and it could very well be the flag.
After continuing the program’s execution further, I end up with the additional ASCII characters “T”, “0”, “4”, “L”, “L”, “c”, “T”, “f”, and “!”, producing the string “0p3nT04LLcTf!”. As it turned out, that was indeed the flag for this challenge! After this last iteration with the exclamation point, the program crashes.
Many thanks to Alessandro for creating this challenge! I learned a lot while working through it, and I had a great time in the process.